Time series analysis: a vital component of the SuDS toolbox?
Martin Fairley ACO Technologies plc, Richard Kellagher HR Wallingford, Bridget Woods Ballard HR Wallingford
An earlier blog article highlighted the use of time series rainfall analysis (TSR) in determining pragmatic approaches to delivering the SuDS goal of Interception. The work (done on behalf of three major supermarkets) illustrated how Interception might be achieved, and promoted a probabilistic approach – based on the number of events for which Interception was delivered on average, through the year.
TSR should underpin a number of SuDS goals relating to quantity and quality management. The current position of using fixed design rainfall events to predict and control SuDS hydraulic performance will not necessarily deliver the objective of effectively matching greenfield catchment performance characteristics – particularly for volumetric control. In terms of designing effective treatment systems, we are essentially interested in the long term removal of contaminants – the performance for which will be defined by the processes occurring during the large number of sub-annual, small rainfall events (which will be influenced by, for example, soil conditions, system state, runoff volumes and velocities etc).
For routine design, we are limited by the lack of accessible TSR datasets, and the skills and modelling capacity to process the data. The focus on surface water runoff quality management has also been low and there are no fixed criteria or standards for contaminant removal, therefore drivers to adopt more complex approaches are limited. Green SuDS are accepted as providing contaminant reduction, as evidenced by quantitative monitoring campaigns here and internationally.
The current draft of the National Standards for SuDS requires that receiving water quality is not impaired by surface water drainage systems and this will drive a requirement to demonstrate that adequate treatment has been put in place. This will drive the need for proprietary manufacturers to demonstrate their product performance to a standardised test which allows consistent comparison. Such a test will need to reflect the likely sub-annual flow rates for the catchment being treated – rather than their performance at specified hydraulic design flow rates.
This brief article is intended to encourage enquiry and debate – it is based around the development of product testing regimes developed over the last 12 or so years in Germany.
Time series simply reflects the collection of data relating to storm size. It is not the intention to discuss what constitutes a storm, nor methods of data collection or its analysis; simply to outline the potential application to UK SuDS design and performance assessment. Ideally data should be accumulated over a number of years – sample size will of course determine confidence level which will tend to emphasise frequent events over the less frequent. When ordered by storm size one may expect to observe many events of low magnitude. Indeed the proportion of large infrequent events will be relatively small – as illustrated in Figure 1 below, here over 60% of all events produce only 1-5mm of runoff.
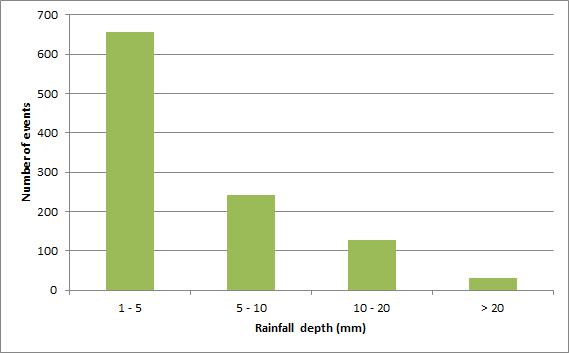
Figure 1.Numbers of rainfall events for different depth ranges (with a minimum inter-event dry period of 6 hours). Source: HR Wallingford.
Analysis of TSR rainfall data underpins the product testing methodology used in Germany (the DiBT Standard) which is driving the development of effective stormwater treatment products. The procedure requires the use a range of flow test regimes to demonstrate the capabilities of these proprietary products. As with Interception, the analysis is founded on the approach that it is best to manage the very frequent storms thereby addressing the issue practically rather than designing for the extreme events just to address flooding. It is noteworthy that there is no agreed and objectively defined approach for design storms for water quality in spite of all the SuDS guidance over the last decade. Figure 2 shows the basis of the analysis of flow rates developed from rainfall data from Bavaria, Germany.
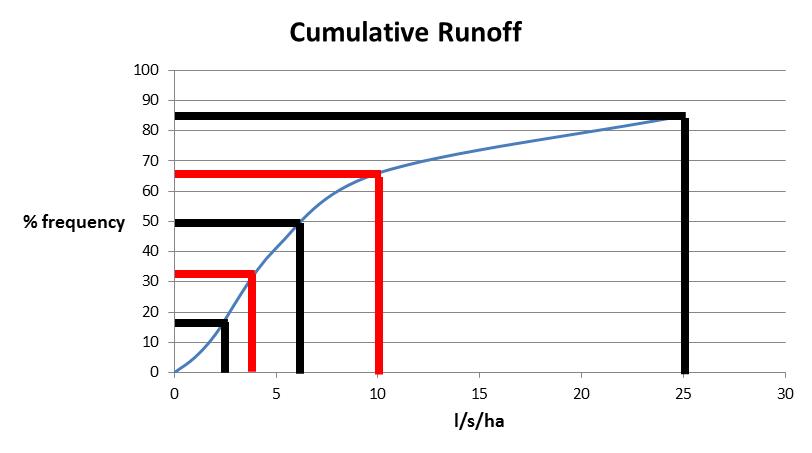
Figure 2 Example cumulative times series runoff. Based on Schmidt T. G. et al 2010
The red intersections on the graph indicate the arbitrary selection of cumulative percentage boundaries: so 1/3 of all storms create runoff of 4 l/s/ha, and 2/3 of all storms can be described as creating 10 l/s/ha runoff or less – this data indicates that significantly larger rainfall events are experienced in Bavaria. An analysis of UK data would be expected to result in a different flow profile distribution emphasising the need for relevant location specific information to be applied. .
The black intersections indicate the selected test flow regimes and relate to the percentile mid points between the boundaries as described. Such an approach allows appropriate weighting to be given to the flow rate. In the case of the DiBT standard the 17th, 50th and 85th percentile storms are weighted equally by total volume rather than by duration – with the lower flow rates running for a proportionately longer time as shown in Table 1. Tests 1-3 are undertaken with substances added to the influent in order to represent typical pollutants found in urban runoff. Test 4 seeks to measure remobilisation under extreme hydraulic load.
| Flow test | Intensity | Duration | Water volume |
| l/s/ha | Min | l/m2 | |
| 1 | 2.5 | 480 | 7.2 |
| 2 | 6 | 200 | 7.2 |
| 3 | 25 | 48 | 7.2 |
| 4 | 100 | 15 | 9 |
Table 1. Test flow regime for proprietary products based on DiBT Rainwater treatment plant 2011
What results is an approach to testing that is realistically premised on relevant hydrological conditions. Equally compelling is the extent to which such an approach might further inform SuDS design holistically from a quality perspective. BS 8582 – the 2013 Code of Practice for Surface Water management for Development sites supports the concept but rather side-steps the issue by stating that treatment components are required for all frequent events – up to the 1:1 year return period. Use of TSR or the use of key flow rates based on its analysis can underpin robust approaches in determining what those events imply volumetrically, consequently informing design theory and practitioners alike.
The acceptance of the relevance of TSR will lead to the development of SuDS tools to facilitate the design of drainage systems for providing effective treatment. This should lead to the integration of traditional SuDS components with proprietary products providing a wide portfolio of methods for drainage designs for all circumstances.
The intention of this article is to stimulate discussion of the topic in context of the imminent National Standards and forthcoming revision of the CIRIA SuDS manual.